Improving your deliverable

Slide with text "improving the deliverable" on it

So, you’ve done your best to think about your audience when introducing, presenting, and sharing your deliverable. Congrats – you’ve avoided some known hurdles!

Now we tackle the unknown – issues that crop up as people review / use your deliverable.

This probably looks pretty familiar to any UXer: 

Flow showing: Define the problem and audience > Research the problem and audience > Ideate and develop solutions > Try it out, and iterate as needed

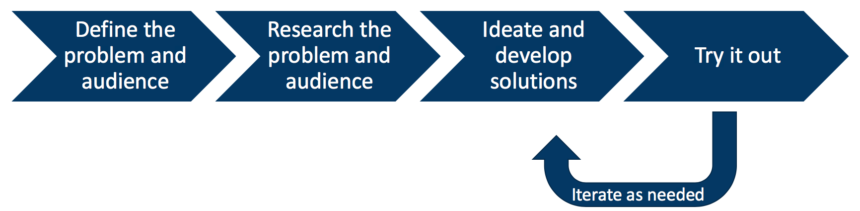
Same idea applies here – figure out who is having an issue and why, ideate how to fix, try it out, and iterate if needed.

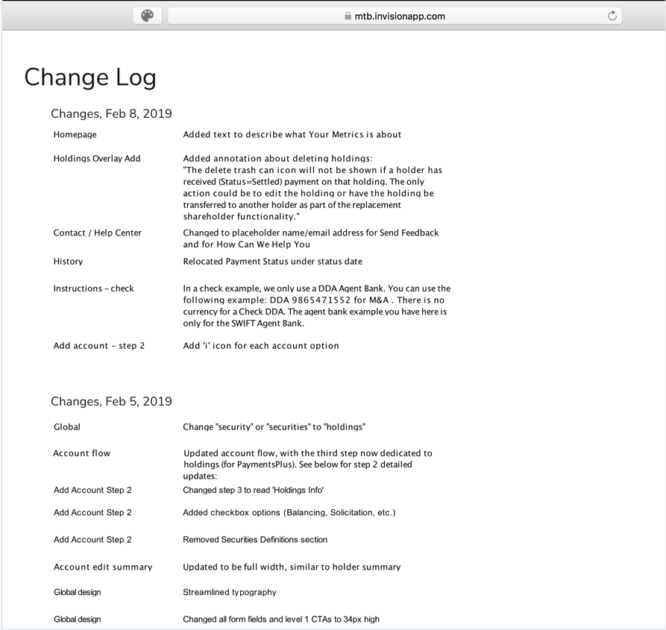
Typically, I haven’t done formal user research here, but based my ideas on anecdotal evidence. For example, hearing a BA explain over and over how to use Invision to developers gave me a pretty good clue that there needed to be ‘how-to’ info on my first page.

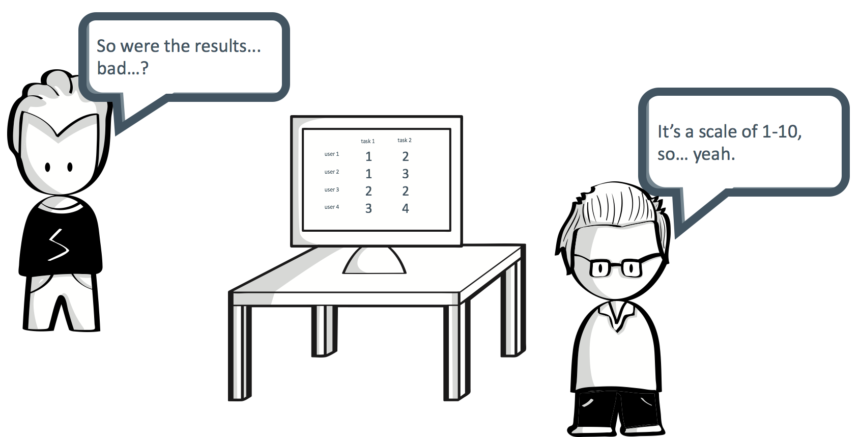
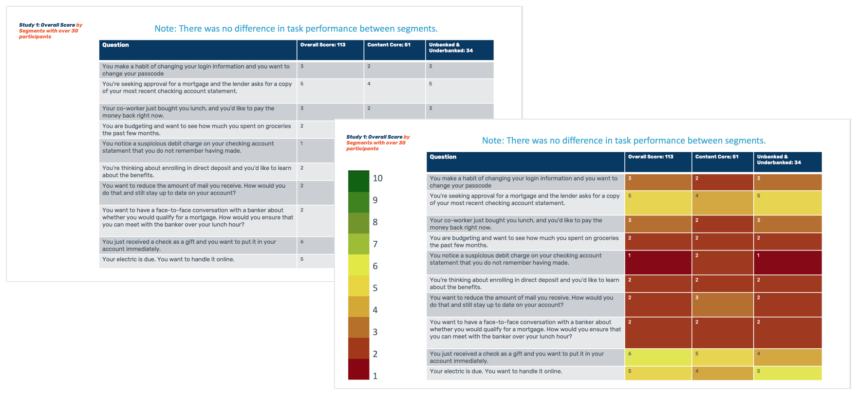
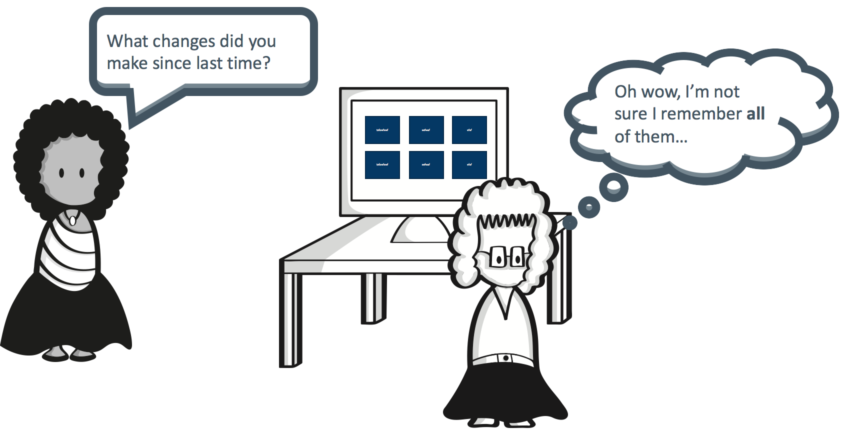
Here are two example situations and examples of possible ‘fixes’:

One person says "So were the results... bad?" The other says "It's a scale of 1-10, so... yeah". Screen behind them shows a table filled with 1s through 4.
The numbers are meaningful to the researcher; not so meaningful to the audience. *
Shows one table without colors or scale, another with scale and colors
Before and after: Without a scale or color-coding, then with a scale and color-coding
One person says "What changes did you make since last time?" The other thinks "Oh wow, I'm not sure I remember all of them..."
I’ve found some stakeholders care greatly about tracking changes. Even if I’ve emailed them out, I’m in trouble if they ask me about them during a meeting!*
Example change log for wireframes, in an Invision link
But if I put my change log right in my deliverable, the conversation becomes easier.

*Work created with Scenes™ by SAP AppHaus (https://experience.sap.com/designservices/scenes)

Leave a Reply

Your email address will not be published. Required fields are marked *