Here’s a look what data tools I use as a product manager, and what I use them for. This might be useful for those who aren’t yet PMs, or those who are and are curious how others look at information. I’m sure it differs between companies.
For reference, I work at a B2B SaaS (business-to-business software-as-a-service) company.
Customer Service Tool
- I mostly use this to see information like cancellation notes and feature suggestions, entered by our awesome customer service team.
Site Analytics
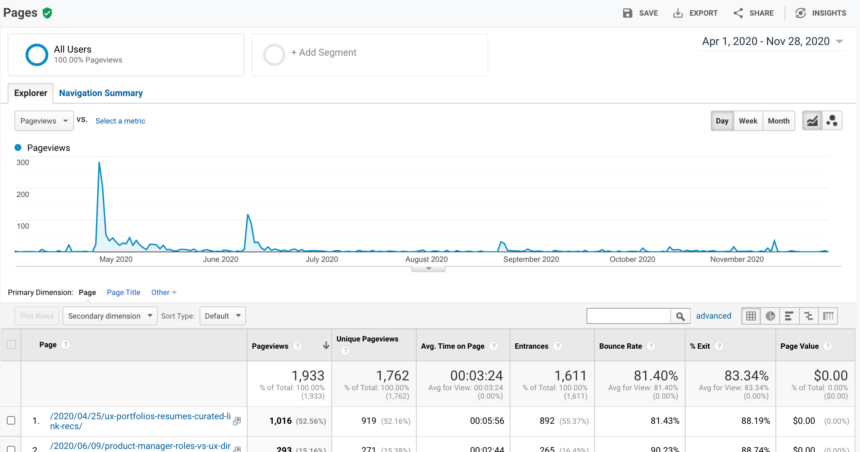
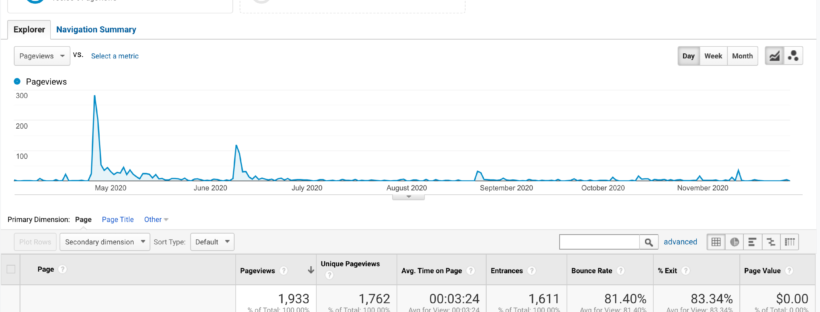
- Since this is a web app, I use this to see pageviews / unique page views and time on page.
- Now that we are all working from home, there is no way to exclude current employees, so this data needs to be taken with a large grain of salt. But comparisons are still useful.
- I have also used this to see things like common screen resolutions and demographic information.
- Example tools: Google analytics, KissMetrics
Product Analytics Tools
- This is a useful tool for exploring data via visualizations such as funnels or graphs.
- We can create dashboards with key graphs so that we can easily check on a set of analytics.
- Only events that have been ‘tagged’ in our system show, so this is something we have to think about when preparing projects – what are we going to want to track, beyond what we can see in the database? For example, we may want special events for steps in a flow so we can track progress and drop off. Or we might want to track how a page’s filters are being used, or any number of other customer actions.
- We also have a product analytics software where we can look at product metrics like number of sign ups, cancellations, etc. over time.
- Example tools: MixPanel, Amplitude
Database Query Tool
- We can query the database directly with SQL (Structured Query Language). This is useful for a detailed analysis of a specific topic. I tend to use this tool the most.
- I look at detailed info, such as what kinds of information customers are entering into a specific field. Are they using it the way it was intended?
- I also look at more aggregate data, using ‘count,’ to see what kinds of patterns and trends I can see. For example, how many people did x in the last month vs. the month before? How many people are using option a vs. option b?
- I can also split customers along segments and see if data varies that way. For example, do our basic and premium customers have different usage trends? Do customers in different industries tend to use different features of the app?
- Much like with the product analytics software, we can put query results in a dashboard. The visualization tools offered in our tool are more basic, so I tend to use tables rather than visuals.
- Example tools: Amazon QuickSight, Redash, MetaBase
If you’re a product manager, I’d love to hear what tools you use!
